A Tale of Two Metros
Thought about my first piece a tale of two metros comparing Seoul
Seoul and DC opened their subways in 1974. I rode both for the first time in 1979, when each had about five or six stations on one line. What a difference 45 years has made. Seoul has built a world-class subway system with over 23 lines and 600 stations stretching over 200 miles, and is now the largest urban train system in the world, while DC has built five lines and many consider it to be among the worst subway systems in the world. I have been riding both ever since, and I love the Seoul Metro. I’m glad it has become one of the best subways in the world, but I am very disappointed at the deterioration of the DC subway system.
Seoul: A World-Class System in 45 Years
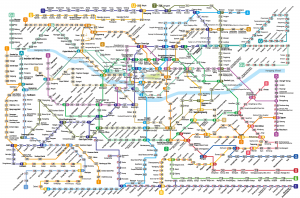
Since opening in 1974, the Seoul city subway has grown to be the biggest subway system in the world, with 23 lines and over 500 stations stretching over 200 miles The total length is approximately 975.4 km (606.1 miles). It connects many outlying cities as part of one integrated mass transit system. It is fast, efficient, cheap, and safe. Most people in the Seoul metro area live within half a mile of a station.
There are five more lines being planned and built. By 2025, there will be over 600 stations. They are building three lines of express trains buried deep underground called the GTX system. The first line has opened, and the other two lines will be operational by 2028. When finished, one will be able to travel from one part of Seoul to another within 30 minutes. The second line opens December 28, 2024 and another line opens next Spring.
The system takes in an annual revenue of $2.6 billion. The total ridership is approximately 2.9 billion passengers annually, with about 7.32 million passengers per day. Signs and all announcements are in Korean, English, Chinese and Japanese. Each subway station has a TV screen for stop announcements Fare machines operate in four languages as well. The cost is modest, about $1 per ride, payable by T money cards, credit card, or phone app.
Subway attendants speak some English and are very helpful and friendly. Every subway stop has clean restrooms, services, and restaurants, with some stations featuring long underground shopping malls. The metro system makes so much money from renting shops, services, and advertising that fares are heavily subsidized. The trains are very clean, safe, and well-maintained. Foreign visitors love the system and use it frequently as it is quite foreigner-friendly. Ridership at night is strong due to strict drunk driving laws.
DC Metro: A Broken System
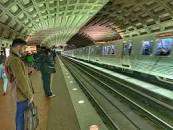
In contrast, the DC Metro has five lines and about 125 stations. It is finally connected to Dulles Airport years after first planning to extend to the airport. The system was planned to be a model of modern urban transit, but it has faced numerous challenges over the years, including crime concerns, derailments, financial difficulties, maintenance issues, reliability concerns, and does not connect to many employment and shopping destinations, especially in the suburban areas.
The DC Metro’s ridership has declined, and it struggles with crime, financial issues, maintenance issues, reliability, and safety issues. The system’s infrastructure is aging, and there have been several high-profile incidents that have eroded public confidence. The fare system is more expensive compared to Seoul, and the service is less frequent and less reliable. and there is no restroom service available on the train system. The train stations are dimply lit, the public address system does not work. But on the bright side, the attendants are generally helpful.
The DC Metro’s annual operating budget is around $4.8 billion, but it still faces financial challenges. The system relies heavily on fare revenue, which has been declining. In contrast, Seoul’s metro system is heavily subsidized by revenue from renting shops, services, and advertising, making it more affordable for passengers.
Expand or Die
A Tale of Two Metros
.The system needs to be expanded to Ft Belvoir, Richmond and Quantico in Virgina and Baltimore in Maryland adding 20 to 25 new stations, and a new Potomac train bridge needs to be built. The Metro system should consider setting up a high speed Maglev train linking Richmond, DC and Baltimore/Philadelphia. The technology exists to set up such a system.
Conclusion
The contrast between the Seoul and DC metro systems is stark. Seoul has built a world-class, efficient, and user-friendly metro system that serves as a model for other cities. Meanwhile, the DC Metro has struggled with crime, financial issues, maintenance, reliability, and safety leading to a decline in ridership and public confidence. and it does not go to many major employment and shopping districts in the suburbs.
To improve the DC Metro, there needs to be a focus on modernizing infrastructure, improving safety and reliability, and finding alternative revenue sources to reduce the reliance on fare revenue. Learning from Seoul’s success could provide valuable insights into how to turn around the DC Metro and make it a system that residents can be proud of
Sincerely,
John (Jake) Cosmos Aller
Retired U.S. Foreign Service Officer
Gimpo, Korea
703-436-1402
authorjakecosmosaller@gmail.com
https://theworldaccordingtocosmos.com
These U.S. cities have the best public transit
One factor people consider when looking for a new home is how easy it is to get around. Driving and walking are the most common modes of transportation, but prospective buyers and renters are also increasingly considering public transportation.
In 2018, only 30% of buyers said a new home’s proximity to public transit was “very important” or “extremely important,” according to the 2023 Zillow Consumer Housing Trends Report. But in 2023, 43% said so — the largest increase of any neighborhood characteristic. Thirty-seven percent of renters said living near public transportation was “very important” or “extremely important,” the highest level in the past six years. While many people may want to be close to public transit for career purposes, the benefits may extend beyond work.
“Living near public transportation is more important to today’s buyers and renters than it’s been in at least the past several years. Still, it’s likely not the deciding factor for many movers — more say living in a walkable neighborhood, living near leisure amenities and living near family are important to them,” Zillow senior economist Nicole Bachaud told ConsumerAffairs.
“While the importance of living near public transportation has been on an upswing for homebuyers, the importance of commute times has stayed relatively steady. That could indicate buyers are interested in public transit for more than just their trips to the office and back.”
Knowing how you’ll get around your new hometown is vital before hiring movers to take you there. To help, the ConsumerAffairs Research Team investigated and ranked the nation’s 50 largest cities to see which have the best public transit systems. The analysis is based on 2022 data from the U.S. Department of Transportation’s National Transit Database, and it takes into account how useful, safe, affordable and efficient transit services are in the nation’s top cities.
Bigger isn’t always better. While the country’s most populous metro area, New York City, had the highest-scoring transit system, second place went to the much smaller San Francisco metro area.
Only three of the top 10 transit systems are in the nation’s top 10 most populous cities.
Good transit spans the country.
Among large cities, the top 20 for transit include locations on the Atlantic and Pacific Coasts, the South, the Mountain West, the Midwest and along the Great Lakes.
Transit is safe. The average rate of major safety events across the 50 largest U.S. cities’ transit systems is 3 per 1 million miles traveled by transit vehicles.
Transit is affordable. The average transit trip in the nation’s largest cities costs $2.56 one way, even when accounting for varying prices by distance, peak hours and monthly passes.
Map showing the Top 10 cities with the best public transit.© ConsumerAffairs
Major advantages of public transit
Some advantages of public transit systems include their eco-friendliness, shorter commute times and connectability. Transit vehicles emit far fewer greenhouse gases per passenger mile than a regular car, and you don’t have to fight traffic yourself or pay for parking at your destination. Transit lines also usually connect, making longer trips possible, such as weekend getaways.
Personal advantages abound, too. Riding on local public transit can allow you to see diverse neighborhoods and meet other people you share the city with. Relieved from driving, you can also rest, read or otherwise relax during the journey.
Artificial intelligence can also make public transit systems more efficient and save riders time by analyzing different routes and schedules to get you to your destination faster and without as much of a hassle.
A 2020 report from the International Association of Public Transport found AI offers the potential to adjust transit services in real time, responding to heavy traffic, heavy ridership and sudden emergencies. The report found that AI systems can also help users plan journeys that combine multiple stops and interconnecting services and adapt fares to meet specific goals for both revenue and equity. They can also save agencies money by optimizing fuel efficiency and maintenance services.
Since that report came out, the U.S. federal government has spent millions of dollars helping transit agencies around the country develop AI systems that aim to improve service, reliability and cost in transit systems. The starting point for many of the nation’s most populous cities is already quite good — but there is still much room for improvement everywhere.
Here’s how the cities stacked up:
- New York, New York
- Annual public transit trips per metro area resident: 144.2
- Share of stations ADA-compliant: 51.4%
- Safety score (combining fatalities and serious injuries): 13.07 out of 20
- Average fare revenue per trip: $1.75
The nation’s most populous metro area is served by a large number of transit agencies, with trains and buses covering the five boroughs of New York City itself, as well as areas well into New Jersey, Connecticut and downstate New York. While the average fare revenue is higher than most, it’s still cheaper per trip than in Pittsburgh, Pennsylvania, and Buffalo, New York.
- San Francisco, California
- Annual public transit trips per metro area resident: 53.6
- Share of stations ADA-compliant: 97%
- Safety score (combining fatalities and serious injuries): 13.91 out of 20
- Average fare revenue per one-way trip: $1.63
With the third-worst commuter traffic in the nation, San Francisco residents might be desperate for other ways to get around. Fortunately, Bay Area Rapid Transit connects the city with its suburbs, and the Muni bus and train system – including the city’s famous cable cars – gets people around the city itself. There are also free shuttles to get people to and from public parks.
- Los Angeles, California
- Annual public transit trips per metro area resident: 29
- Share of stations ADA-compliant: 100%
- Safety score (combining fatalities and serious injuries): 16.48 out of 20
- Average fare revenue per one-way trip: 49 cents
Los Angeles, well known as a sprawling car-oriented metropolis, has a transit system that doesn’t get as much use per capita as other cities’ services. However, it’s one of the safest and most affordable transit systems nationwide.
- Richmond, Virginia
- Annual public transit trips per metro area resident: 8.5
- Share of stations ADA-compliant: 100%
- Safety score (combining fatalities and serious injuries): 18.27 out of 20
- Average fare revenue per one-way trip: 24 cents
With free local bus fares across the city, including high-speed buses with some dedicated lanes that provide service every 10 minutes on weekdays and every 15 minutes on weekends, Richmond’s public transit system is safer and more efficient than many other large cities’ services. Unfortunately, it is used less frequently than any other system mentioned in our top 10 list.
- San Diego, California
- Annual public transit trips per metro area resident: 21
- Share of stations ADA-compliant: 100%
- Safety score (combining fatalities and serious injuries): 14.74 out of 20
- Average fare revenue per one-way trip: $1.10
A new safety initiative, expanded service and upcoming investments in new vehicles, including electric buses, are drawing riders to San Diego’s trolleys and buses, which serve the downtown area and the surrounding communities.
- San Antonio, Texas
- Annual public transit trips per metro area resident: 12.6
- Share of stations ADA-compliant: 100%
- Safety score (combining fatalities and serious injuries): 18.44 out of 20
- Average fare revenue per one-way trip: 58 cents
San Antonio’s bus service spans the city and is set to expand in the coming years. The agency that runs it, VIA Metropolitan Transit, is also working to make its service schedules and maps more comprehensible to prospective users. The city is also considering new zoning rules that would make denser housing along high-capacity bus lines easier for developers to build.
- Boston, Massachusetts
- Annual public transit trips per metro area resident: 47.5
- Share of stations ADA-compliant: 78%
- Safety score (combining fatalities and serious injuries): 14.57 out of 20
- Average fare revenue per one-way trip: $1.63
In Boston, a city well known for confounding even local drivers with one-way streets and hairpin turns, it’s tempting to let someone else handle navigation. Even with a relatively expensive average fare and incomplete ADA compliance at stations, the city’s MBTA trains and buses are relied on more heavily than transit vehicles in other large cities.
- Seattle, Washington
- Annual public transit trips per metro area resident: 36.7
- Share of stations ADA-compliant: 99.1%
- Safety score (combining fatalities and serious injuries): 14.52 out of 20
- Average fare revenue per one-way trip: $1.57
Seattle’s public transit system, which includes buses, trains, and ferries, links its suburbs, downtown area and nearby islands. In 2024, the city is asking voters to raise their taxes to pay for a 20-year transportation plan that includes pothole repair and expanded transit services.
- Washington, D.C.
- Annual public transit trips per metro area resident: 36.7
- Share of stations ADA-compliant: 100%
- Safety score (combining fatalities and serious injuries): 15.41 out of 20
- Average fare revenue per one-way trip: $1.29
The D.C. area’s roads are so famously congested that people joke there is no rush hour at all — except all the time. Fortunately, the Metro system encompasses trains, buses and subways run by city officials and state and local agencies in neighboring Maryland and Virginia.
- Salt Lake City, Utah
- Annual public transit trips per metro area resident: 26.7
- Share of stations ADA-compliant: 100%
- Safety score (combining fatalities and serious injuries): 11.83 out of 20
- Average fare revenue per one-way trip: $1.07
Bus and rail lines crisscross the city and the surrounding county. The city’s plans for transit expansion call for additional services by 2030 and are being used to tempt Olympic officials to consider it as a location for the 2034 Winter Games.
Table showing best public transit systems.© ConsumerAffairs
ConsumerAffairs
U.S. public transit systems, ranked
In this study, we examined a range of data points from the U.S. Department of Transportation’s National Transit Database and calculated a score for each city, with a maximum number of 100 points achievable. You can read the full methodology below.
Why you should consider moving to a city with a good public transit system
When you’re looking for your next place to live — whether near where you already call home or somewhere farther afield — it’s worth noting how close transit services are and how well they’ll get you where you want to go.
According to Nicholas Julian, the senior program manager for land use at the National Association of Home Builders, builders and developers are noticing this interest. He observed that the move toward “transit-oriented development” has been decades in the making, with governments and private companies working to build housing along existing transit routes to reduce traffic and pollution.
He noted that many cities are also rethinking minimum parking requirements to reflect residents’ desire to drive less and discourage additional cars from clogging the roads.
Although Julian works most directly with people involved in suburban development projects not designed explicitly around transit, he notes that “any type of access to public transit … will be advertised” to prospective buyers or renters.
He pointed out that some developers are stepping forward to reduce driving while improving people’s ability to get the services and experiences they want. For example, Culdesac Tempe, in Arizona, is a development that actively discourages residents from owning cars while providing free transit, reduced ride-sharing costs and free e-bikes to at least some residents.
“If you can build a car-free community in Tempe, it’s probably possible just about anywhere,” Julian said. That may also mean you can live a car-free or car-light lifestyle in just about any other city, too.
Methodology
The ConsumerAffairs Research Team conducted a comprehensive analysis of the public transit systems in the 50 most populous metropolitan areas across the United States and scored each on a point scale from zero to 100. To determine which cities had the best public transportation, we looked at the following metrics:
- Usefulness to riders: We defined how useful a transit system was to its city’s residents based on three factors:
- First, we calculated how many independent passenger trips the population took in 2022 in relation to the metro area’s population. This information was based on the National Transit Database annual metrics for 2022. (25 possible points)
- Second, we calculated how far passengers traveled in 2022 per resident in the metro area. (20 possible points)
- Third, we looked at how easy the main public transit system was to access for people with physical disabilities. We used the 2022 National Transit Database information on transit stations to calculate the percentage of all ADA-compliant systems. (10 possible points)
- Safety: Based on the National Transit Database’s Safety & Security Major Event Time Series data for 2022, we calculated the number of major events, including collisions and derailments, per vehicle revenue mile in 2022. (10 possible points)
- We also calculated the rate of fatalities and injuries in major events per 2022 vehicle revenue mile. (5 possible points each)
- Affordability: We looked at the fare revenue per unlinked passenger trip based on the National Transit Database annual metrics for 2022. We compared that with the median household income in 2022 for that metro area according to the U.S. Census Bureau’s American Community Survey. (15 possible points)
- Efficiency: We determined the average operating cost per passenger mile based on the National Transit Database annual metrics for 2022. (10 possible points)
This story was produced by ConsumerAffairs and reviewed and distributed by Stacker Media.

Thanks so much for visiting my site. Your comments are welcome but please play nice…. Reply